Author Note & Methodology: This independent political-economy study examines the structural transition in India’s governance model, macroeconomic statecraft, and welfare delivery between the Manmohan Singh administrations (2004–2014) and the Narendra Modi administrations (2014–2026). Rather than treating the two eras as a simple contest of slogans or personalities, this analysis draws directly on primary fiscal and statistical records—including Union Budget documents, Ministry of Statistics and Programme Implementation (MoSPI) releases, Press Information Bureau (PIB) Direct Benefit Transfer (DBT) evaluations, and parliamentary expenditure analyses—paired with institutional and policy comparison to offer readers a grounded, non-partisan framework.
1. Executive Summary: From Rights-Based Expansion to Platform-Driven Statecraft
Over the past two decades, India’s political economy has moved from one distinct governing paradigm to another. The decade led by Prime Minister Manmohan Singh (2004–2014) was anchored in post-1991 global integration, high external capital inflows prior to the 2008 global financial crisis, and a rights-based social welfare architecture exemplified by legislation such as MGNREGA, the Right to Information Act, and the National Food Security Act. By the second term (UPA-II), however, elevated inflation, widening current account pressures, fiscal strain, and coalition decision bottlenecks constrained momentum.
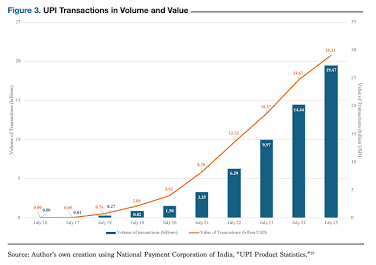
Digital payment scale-up in India. Source: Observer Research Foundation
From 2014 onward under Prime Minister Narendra Modi, statecraft shifted toward centralized execution, digital public infrastructure, and capex-led growth. Key institutional markers include the Goods and Services Tax (GST), the Insolvency and Bankruptcy Code (IBC), the JAM/DBT welfare stack, and a steady climb in Union capital expenditure—reaching a budgeted ₹12.2 lakh crore in FY 2026–27 alongside a fiscal deficit target of 4.3% of GDP.
Comparing the two eras fairly requires separating three distinct dimensions:
- Growth Mechanics: Commodity- and global-liquidity-aided expansion and domestic demand in 2004–2014 versus formalization, infrastructure push, and fiscal consolidation post-2014 (with methodology revisions in 2015 and the COVID-19 shock in 2020–21 requiring careful comparison).
- Welfare Architecture: Statutory entitlements and broad-based subsidies versus identity-linked Direct Benefit Transfers aimed at curbing leakage and standardizing delivery.
- Governance & Political Economy: Multi-party coalition bargaining and decentralized rights frameworks versus dominant-party executive centralization and mission-mode implementation.
2. Primary Sourcing: Fiscal, Infrastructure, and Welfare Benchmarks
Evaluating either era through selective anecdotes distorts the record. Primary public data highlights concrete structural differences in how the Indian state raises, targets, and spends money:
- Direct Benefit Transfers & Subsidy Targeting: Official Ministry of Finance / PIB assessments of DBT across schemes (including PDS food subsidies, MGNREGS wage disbursement, PM-KISAN, and fertilizers) report ₹3.48 lakh crore in cumulative savings/leakage reduction through authentication and deduplication, alongside a sharp expansion in beneficiary coverage and a shift in subsidy share from 16% to 9% of total expenditure.
- Public Capital Expenditure & Project Tracking: Union Budget 2026–27 documents put total expenditure at ₹53,47,315 crore, with public capex budgeted at ₹12.2 lakh crore (up from ₹11.2 lakh crore) and ₹1,85,000 crore earmarked for states as capex loans. Meanwhile, MoSPI’s PAIMANA monitoring for August 2026 tracks 1,731 central sector infrastructure projects (₹150 crore and above) with a revised cost of ₹33.60 lakh crore and ₹16.33 lakh crore incurred to date.
- Macro & Fiscal Trade-Offs: While UPA-I experienced rapid pre-crisis expansion, UPA-II contended with persistent inflation and fiscal slippage after counter-cyclical stimulus. Conversely, the post-2014 era prioritized formal tax architecture (GST), bankruptcy resolution (IBC), and capex crowding-in, while facing persistent questions around informal-sector adjustment, household consumption breadth, and employment quality.
TWO ERAS OF INDIAN POLITICAL ECONOMY (2004–2026)
| DIMENSION | MANMOHAN SINGH ERA (2004–2014) | NARENDRA MODI ERA (2014–2026) |
| Welfare Model | Statutory Rights & Entitlements: Focus on legally binding rights (MGNREGA, RTE, National Food Security Act) and broad targeted subsidies delivered via legacy distribution networks. | JAM / DBT Targeting & Direct Delivery: Transition to Direct Benefit Transfer (DBT) anchored by Jan Dhan–Aadhaar–Mobile (JAM), prioritizing tangible asset creation (PMAY housing, Swachh Bharat toilets, Jal Jeevan tap water) with targeted beneficiary tracking. |
| Growth & Fiscal Stance | Pre-2008 Boom & Stimulus Overhang: High initial growth driven by global tailwinds; post-2008 financial crisis expansionary fiscal policy led to high inflation and rising twin deficits (fiscal & current account). | Capex-Led Push & Fiscal Glide Path: Structural supply-side reforms (GST, IBC implementation, corporate tax rationalization) combined with sustained public capital expenditure and a strict fiscal deficit glide path (targeting 4.3% of GDP for FY27). |
| Decision Structure | Coalition Consensus & Inter-Ministry Balance: Decentralized policy framing relying on National Advisory Council (NAC) recommendations, Cabinet Committees, and multi-party coalition compromises. | Centralized Executive & Mission-Mode Delivery: High degree of centralized executive monitoring (PMO-driven), PM Gati Shakti alignment, and goal-oriented mission-mode execution across central ministries. |
3. Independent Analysis: What Changed—and What Stayed the Same
A genuinely independent reading avoids two common traps: treating 2004–2014 as an unbroken golden age or treating 2014–2026 as a complete break from India’s underlying economic constraints.
A. Continuity Beneath the Contrast
Many headline reforms span governments rather than belonging exclusively to one side. Market liberalization began in 1991, major highway and telecom foundations crossed administrations, and welfare delivery built incrementally across decades. Even in welfare, Aadhaar-enabled digital rails expanded across both periods before reaching full scale in the 2010s and 2020s.
B. The Shift in State Capacity and Execution
Where the contrast is sharpest is how the state executes. Rights-based laws under the UPA sought to empower citizens through legal guarantees and transparency mechanisms, but implementation often varied sharply across states and suffered from leakage and administrative friction. The post-2014 model leaned on standardized digital rails, bank-account seeding, and top-down administrative alignment to compress delivery chains and push large physical infrastructure pipelines.
C. Unfinished Structural Bottlenecks
Across both eras, India has wrestled with three persistent challenges:
- Quality Job Creation: Moving surplus labor out of low-productivity agriculture into productive manufacturing and formal services remains a multi-decade structural test.
- Center–State Fiscal Balance: As central schemes, tax devolution, and state borrowing limits interact, fiscal discipline at both levels shapes public goods like schooling and primary healthcare.
- Institutional Checks & Balances: Strong executive centralization speeds execution, but durable economic credibility also depends on independent statistical trust, regulatory clarity, and federal cooperation.
4. Practical Conclusions for Readers, Policymakers, and Analysts
If you are reading commentary on “Two Indias” or evaluating India’s trajectory into the late 2020s, use these four practical filters:
- Disaggregate “The Decade” Into Sub-Periods: Never flatten 2004–2014 or 2014–2026 into a single number. Global cycles, base-year GDP revisions, and pandemic shocks shift averages dramatically across sub-periods.
- Pair Macro Headlines with Household & Fiscal Reality: Check capex and GDP figures alongside household consumption, real wage growth, debt service, and state-level execution rather than relying on single metrics.
- Separate Welfare Intent from Delivery Mechanics: A rights framework and a DBT platform are not mutually exclusive; judging outcomes requires looking at coverage, leakage reduction, and actual service quality on the ground.
- Look Beyond Partisan Scorecards: India’s long-term competitiveness—in manufacturing, human capital, urban infrastructure, and fiscal health—will be decided by whether successive governments solve structural bottlenecks rather than trade blame over past quarters.
Sources:
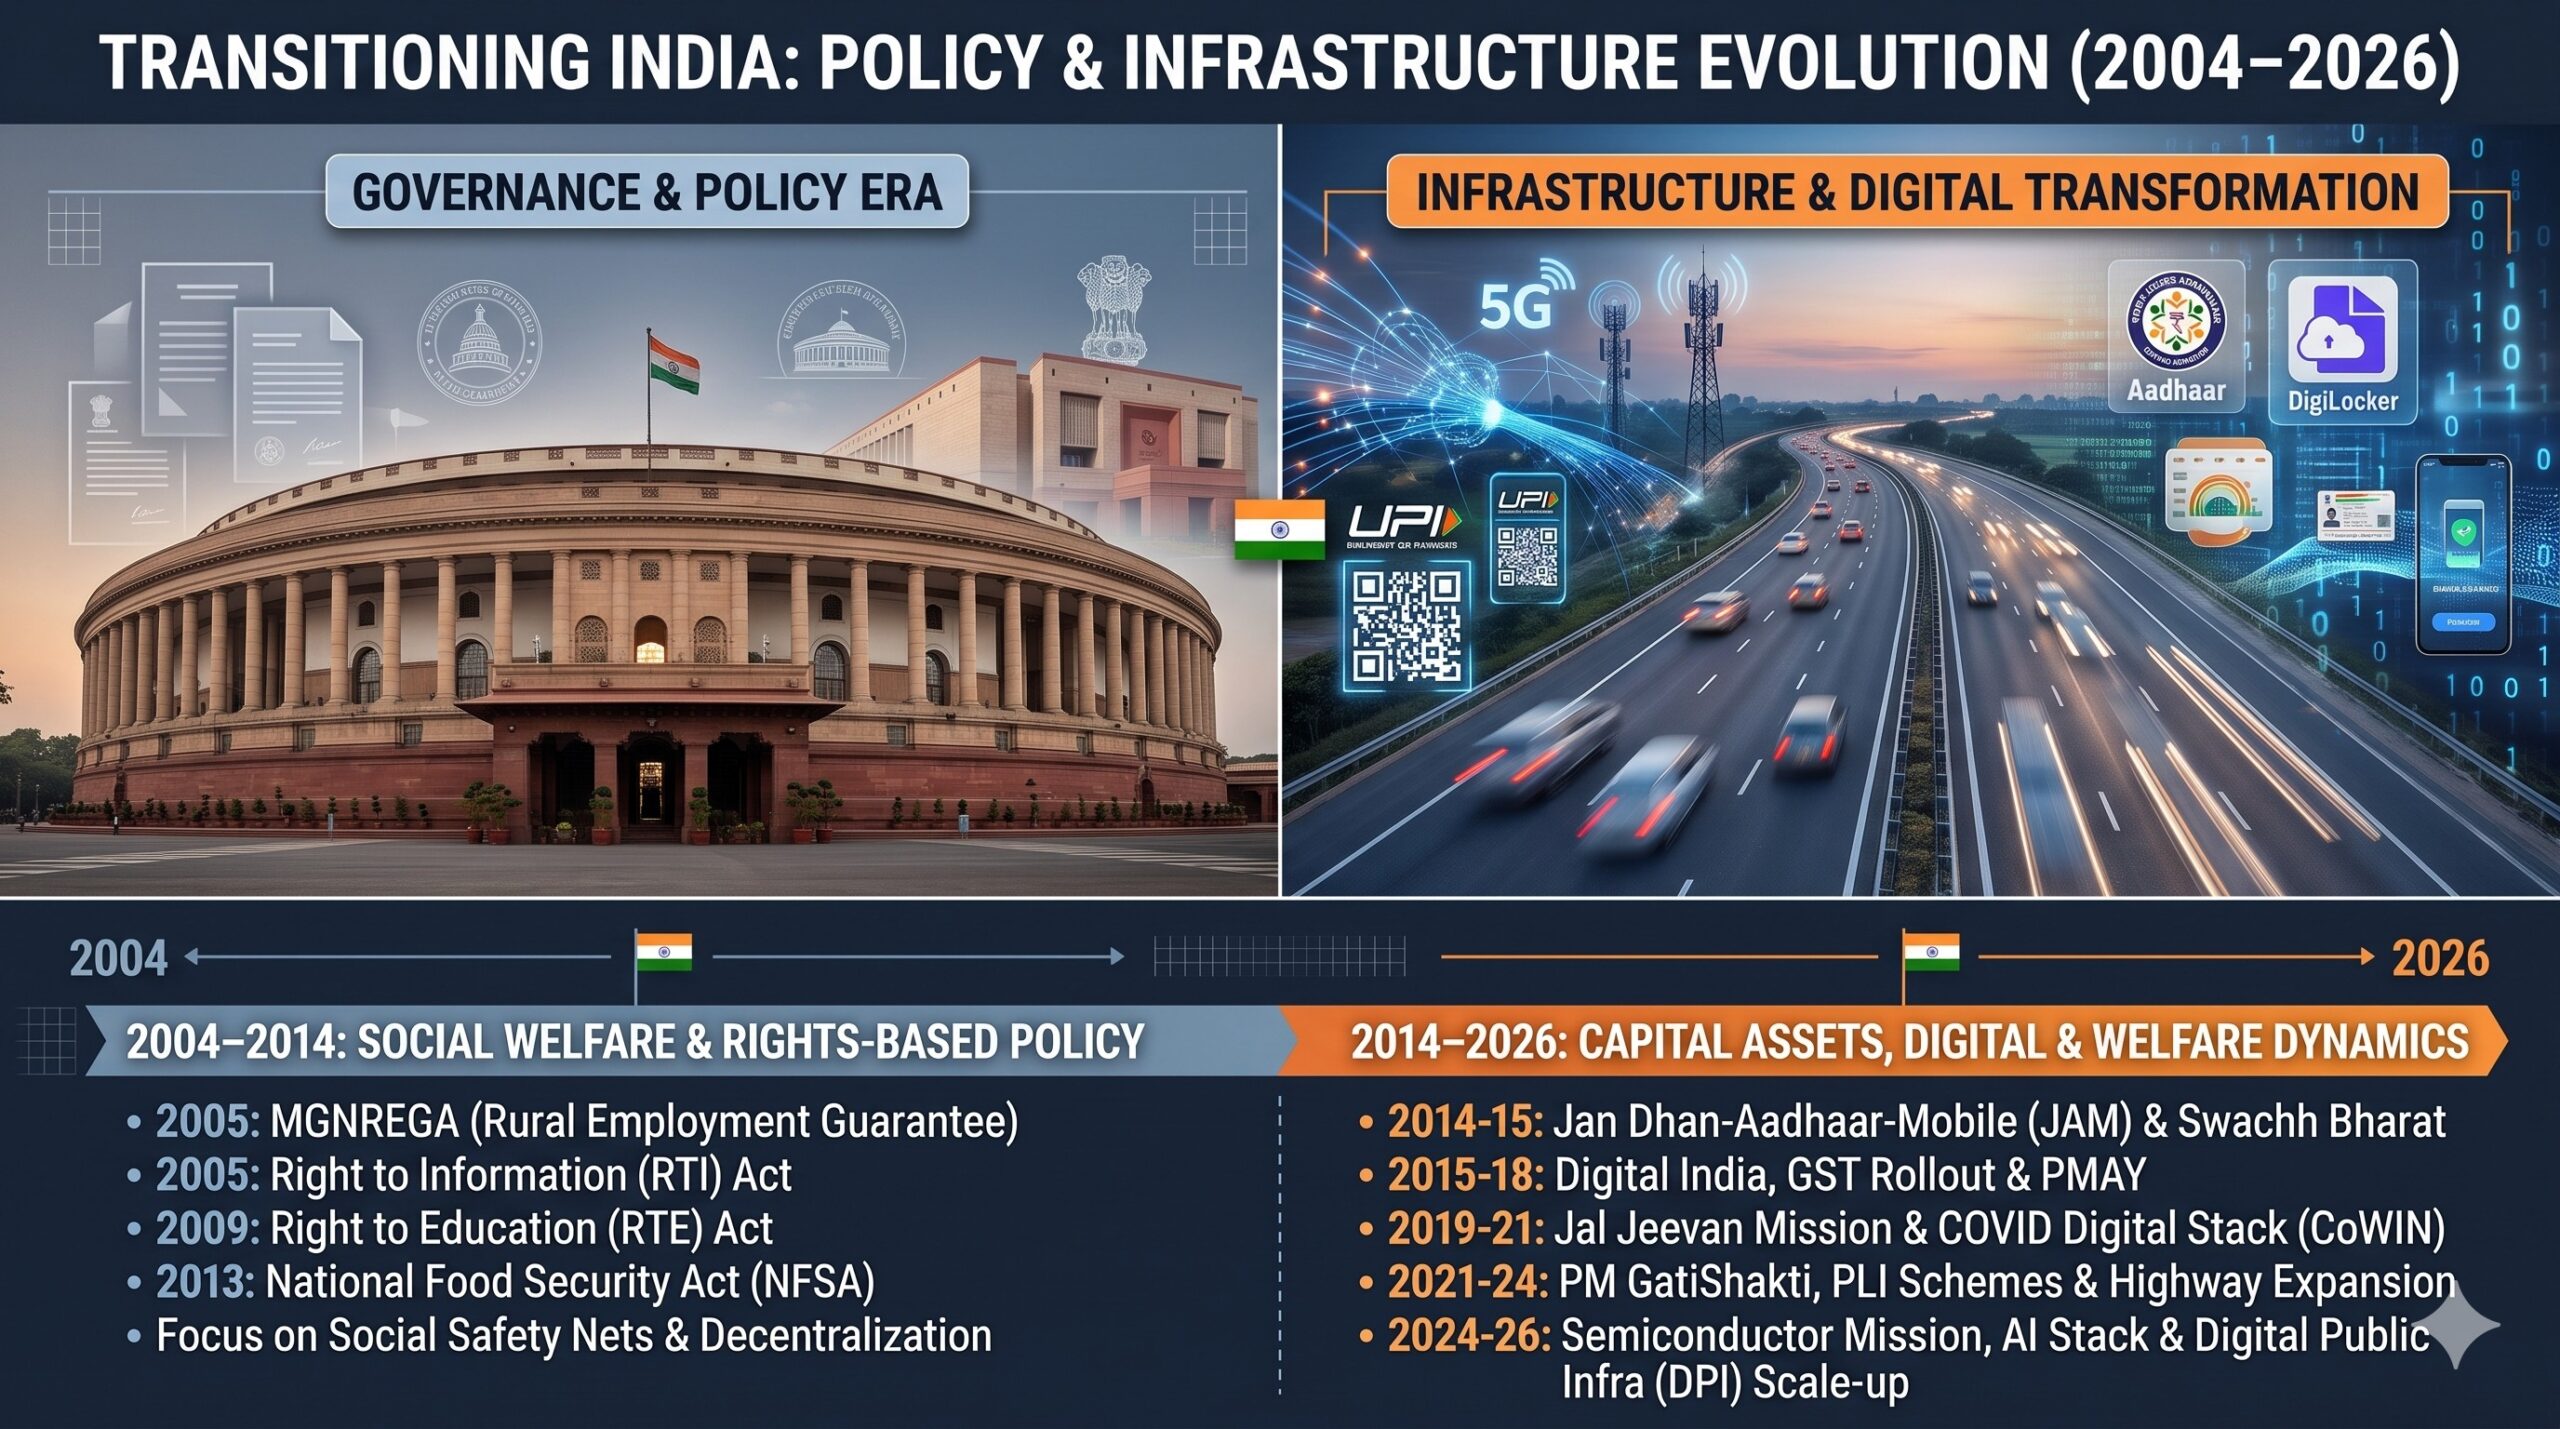
* Conceptual illustration generated using AI